Cyber security assessment and insights dashboard
Spooker Technologies’ cyber security dashboard empowers SMEs to maintain their company’s digital safety through regular assessments such as phishing simulations, vulnerability scans, and risk evaluations. The goal is to transform complex security challenges into digestible, actionable insights, helping business owners and IT managers confidently protect their businesses and employees.

What am I doing?
- 01UX design
- 02UI design
What am I using?
- Procreate
- Figma
Challenge and focus
Many SME business owners and staff charged with IT management have a basic understanding of cyber security but often find the subject complex and overwhelming. While they want to take action to protect their data and systems, they are frequently unsure where to start or how to navigate the vast array of security information.
Key challenges:
- Demystifying cyber security concepts: Presenting assessment results in a way that encourages users to take action without inducing fear or paralysis;
- Actionable insights: Ensuring that the dashboard not only delivers assessment results but also provides clear action items that users can easily understand and implement;
- Maintaining simplicity: The design must keep the experience simple and intuitive, enabling users to order new assessments, track progress, and schedule consults.
The design goals are to:
- Simplify complex cyber security assessments and results;
- Provide a dedicated space for actionable next steps;
- Encourage users to take action without overwhelming them.
Process and design
Process and design
I crafted user journeys focusing on two key activities:
- Ordering assessments: Users can easily request one of three assessment types directly from the dashboard: phishing simulations, vulnerability tests, and risk assessments.
- Viewing and acting on results: Results are presented in a simple, digestible format, with a clear section for action items that users can implement to address security issues.
Wireframes and information architecture
The dashboard was designed to break down the complexity of cyber security into manageable parts:
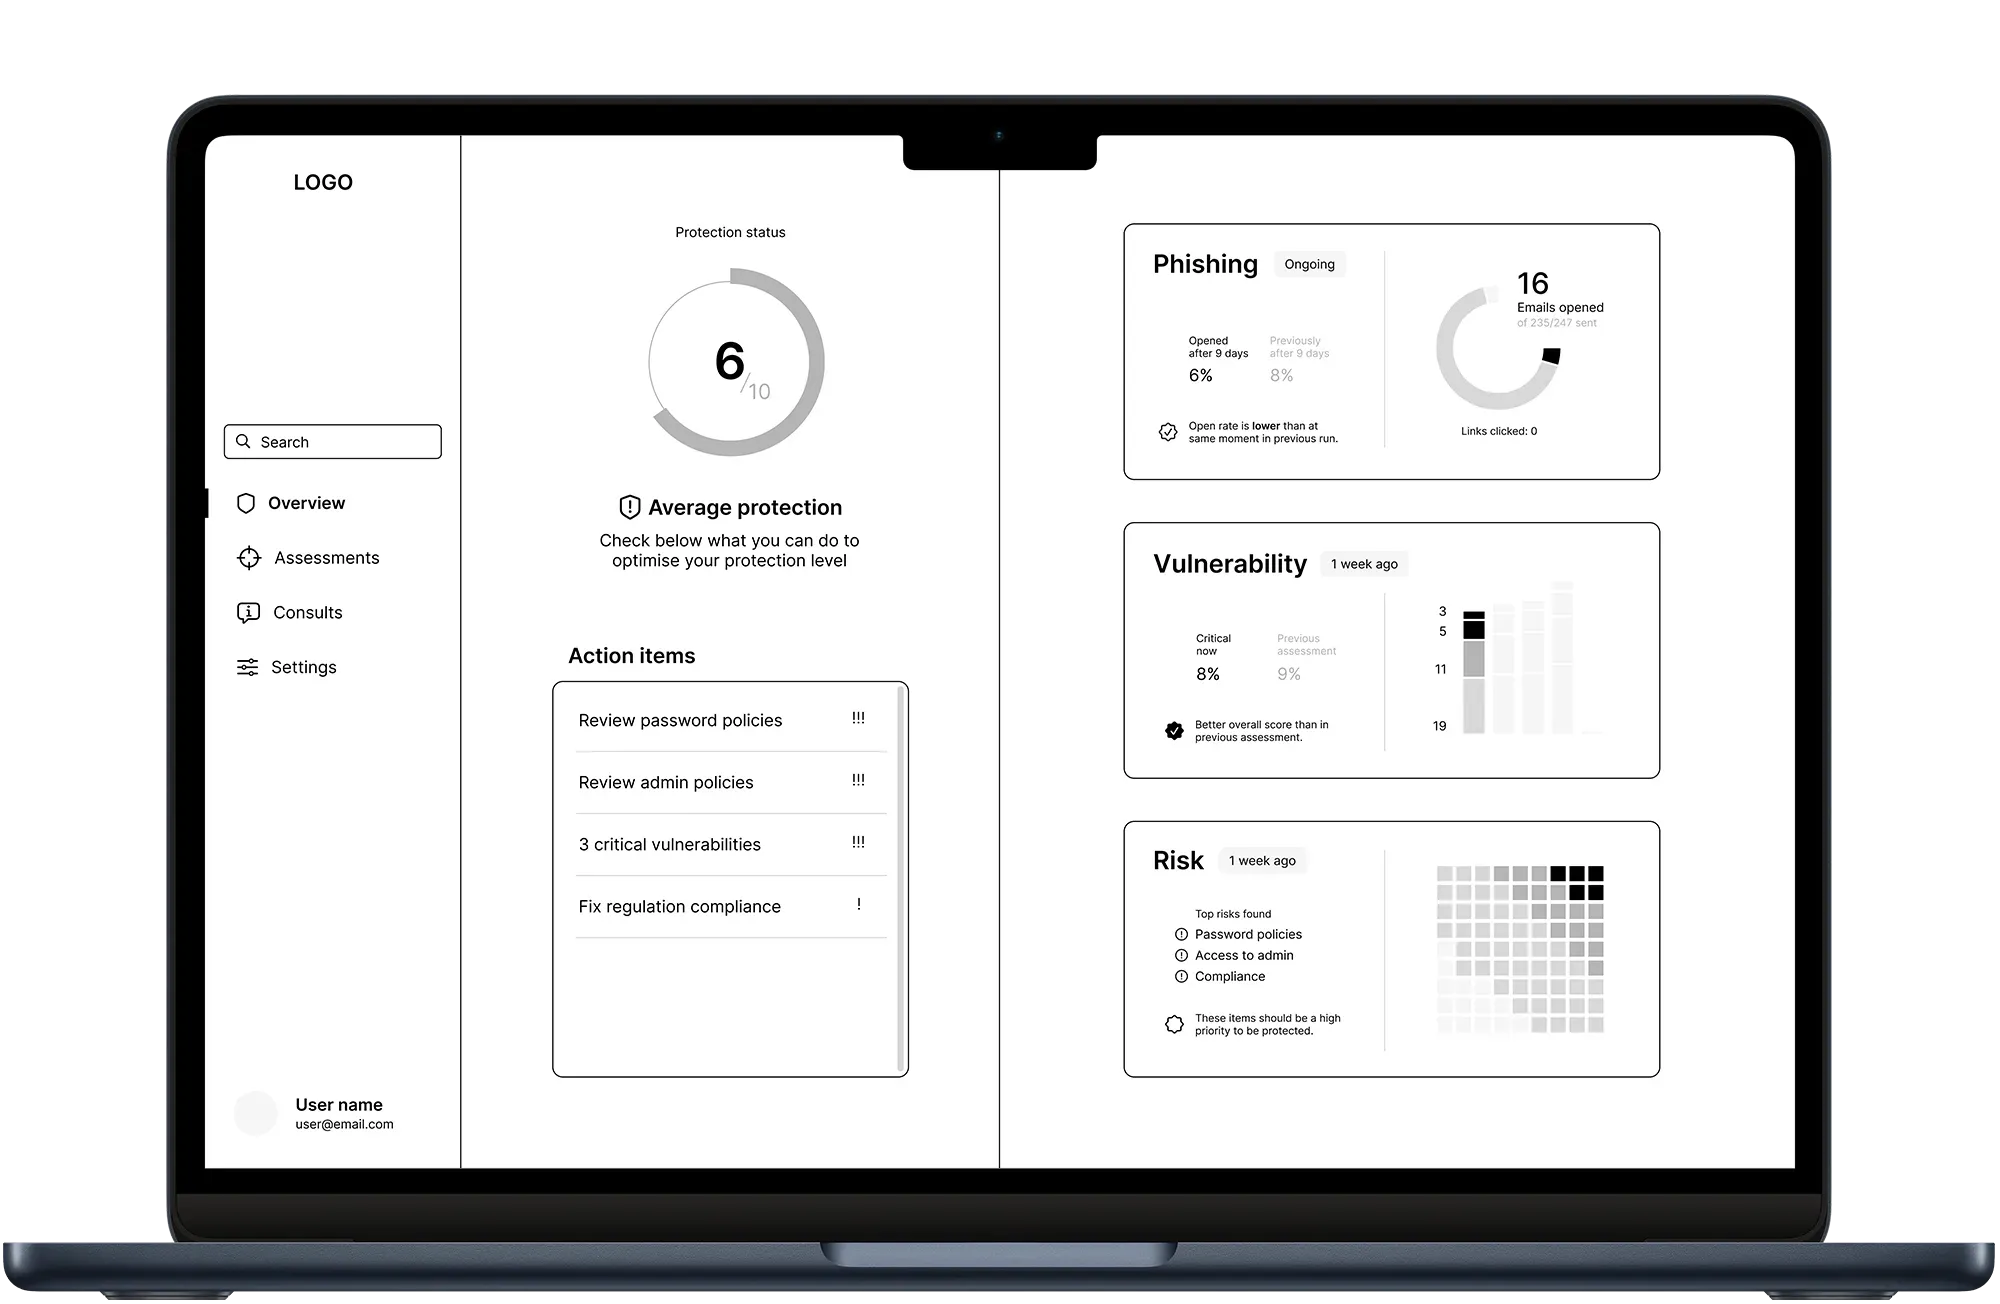
- Phishing simulation results: Displayed as a straightforward report showing how many employees opened a phishing email and clicked on a link, allowing users to see estimate the use of follow-up actions like awareness training.
- Vulnerability test results: Presented in a diagram with issues categorised by severity, giving users an easy way to prioritise the most critical problems.
- Risk assessment results: Displayed in a heatmap grid that highlights the most concerning areas of a company’s policies and behaviour, showing potential impact and guiding users towards effective solutions.
In the Action Items section, each result is paired with suggested steps, helping users know exactly what to do next to address vulnerabilities. The overall architecture was designed to remain intuitive, ensuring that even non-experts could quickly find and act on relevant information.
Prototyping and testing
Although the project is still in its early stages, initial user feedback is being incorporated to refine the wireframes. One of the key focuses of testing will be ensuring that the presentation of results and action items strikes the right balance between informative and reassuring, encouraging users to take proactive steps without feeling overwhelmed by the complexity of cyber security.
Reflection and next steps
Key learnings
Designing for non-expert users in a high-stakes area like cyber security has been a great experience so far. A crucial takeaway has been the importance of breaking down complex information into manageable, actionable insights. While the project is ongoing, initial insights have already highlighted the value of clarity and reassurance in encouraging user action.
Future steps
The next stages of the project will involve further user testing of the wireframes, focusing on how well users can navigate the dashboard and understand the results and action items. Future iterations will also include enhancing a gamification aspect, scoring users’ protection levels against other, anonymised but comparable businesses.